
Ten years ago, after a career spent writing technical reports, I decided to start Quire-the now-game-changing report writing platform. Back then, people like me didn't have a tool that would free up time from report writing tedium so we could focus on the things we were really passionate about.
There had to be an easier way to write reports that didn't involve hours of manual data entry and formatting.
Over the past decade, my team learned a lot by listening to firms like yours, trying out the tools for ourselves, and collecting data from hundreds of thousands of reports to find common hangups in processes. So to celebrate ten years, we want to pass down some of what we've learned to you. Whether or not you use a tool like Quire, making small changes like these can make a huge impact on your overall technical report writing process efficiency and effectiveness.
1) Clearly define roles and responsibilities
No matter the size of your team, make sure roles and responsibilities are clearly defined. This way, you avoid repetitive, time-consuming reviews or having “too many cooks in the kitchen” with different organizational opinions.
Allow your team to focus on their roles by giving them the tools and access to perform only what is required of them. Consider breaking up and delegating longer report tasks. For example, you can designate separate tasks and owners for the field visit, appendix creation/organization, and adding report content. That way, progress can occur in parallel. Allowing your team to work together on the same report decreases time to reach the finish line and lets everyone do what they do best.
2) Assign milestones on the way to delivering a final report
When multiple projects are in motion, how can you remember each report's current status (without sending annoying and time-consuming emails that make you look a little less organized)? Create a clear set of milestones that each report deliverable must achieve before it can be submitted to the client and/or archived. An example of these phases or milestones could be “Data Entry,” “Ready for Review,” “Senior Reviewed,” “Draft Approved,” and “Final Report Delivered.” This approach will improve quality and ensure reports do not fall through the cracks.
3) Use defined templates
Using old reports as the basis for your brand-new projects? Then you're probably recycling the same overused terms or making avoidable mistakes. Encourage report writers on your team to develop and use a defined template for every job rather than using old reports to write new ones. Well-designed templates encourage more critical thinking and result in fewer carry-over mistakes.
4) Call out instructions to writers
Companies often leave “instructional text” in their templates to provide guidance to writers. However, large blocks of instructional text are often overlooked. Writers simply delete the stand-in text before starting to fill out that space-losing their original reference!
Think of what catches your attention when you're trying to read through something quickly. For example, you can encourage writers to read and follow instructions by condensing them into concise bullets that are easily scanned. Use numbered bullets to emphasize when a particular order of steps should be followed. You can also use a bolded font on action words and try brightly colored highlights to make the most important details stand out.
5) Don't repeat yourself
We've said it once and we'll say it again. Stop saying the same phrases over and over.
Every time you repeat information in your report, you have to type it twice, which can increase the likelihood of mistakes. Eliminate repetition of salient data or entire repeated sections. This will reduce the burden on writers and free up reviewers' time. Have critical salient data you don't want your client to overlook? Instead of using repetition, try a tabular presentation near the top of the report.
6) Use clear report organization
When you're looking for information in a report or on a webpage, what's the first thing you do? Studies indicate that most readers scan through the biggest, boldest text first-the headers.
Clear report organization should guide the reader to the main points quickly. Use clear, numbered headers and other organizational techniques like bullet points to build a more organized overall product.
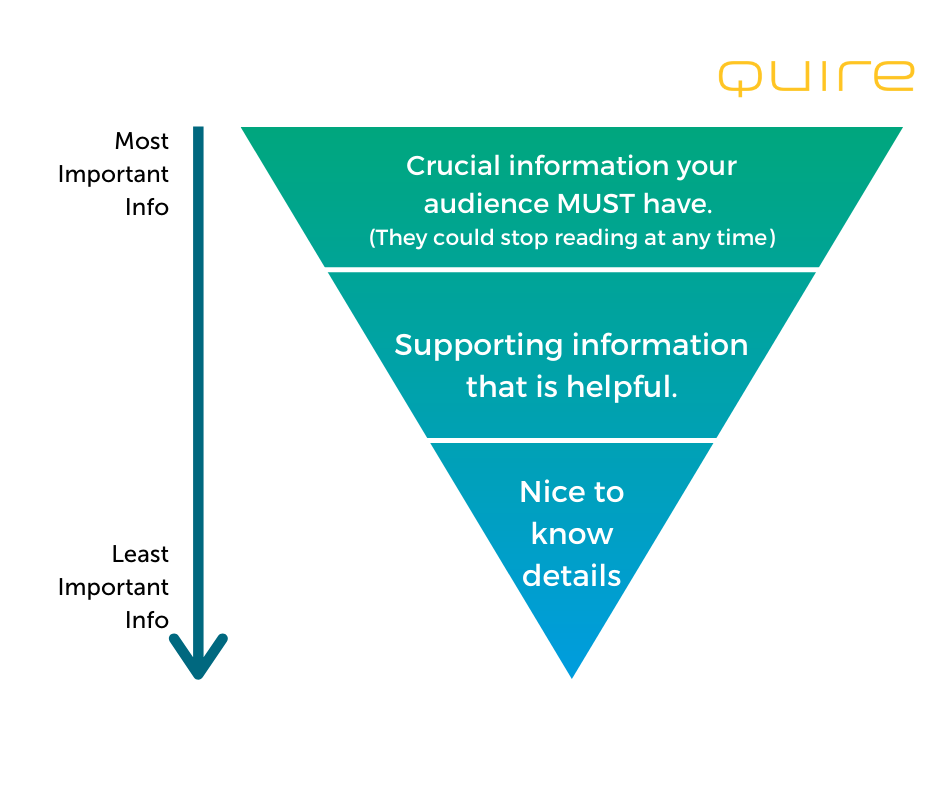
7) Visualize an inverted pyramid for your information hierarchy
Decision makers are looking for crucial, determinative items upfront when they first sink their teeth into your report. So, put the most important facts first-information that is key to decision making. What are your findings, conclusions, and recommendations? With the inverted pyramid method, information gets gradually more nice-to-know (and potentially less important for decision making) the further you move down the report. Methodology, calculations, and many minor details are certainly important, but these should appear further down in the report and should support the information conveyed at the beginning.
8) Provide value-added summaries upfront in the report
Not every client has the opportunity (or need) to read your report cover-to-cover. Consider presenting an easy-to-digest summary that allows the reader to come away with a clear understanding of the business decision they need to make based on the content within the report. A tabular or bullet-point summary works well for this.
Remember, there's no need to repeat yourself. (Please excuse our repetition.) A high-level summary of key takeaways does not need to get into the nitty-gritty details. An alternative and useful summary could simply provide embedded links to the appropriate report sections allowing the reader to quickly “jump” to areas of importance.
9) Add tables whenever possible
Be honest-would you rather read through a dense, narrative Word document or glance at an Excel spreadsheet? If you said a spreadsheet, we're with you. Tables help distill data into the most relevant and easily consumable presentation. Where it makes sense to do so, present data in a tabular format as opposed to a narrative.
10) Don't relegate your site photos to just the appendix
Who doesn't love a good picture book? Whenever possible, include images within the body of the report. Images help to inform your reader and put less pressure on your narrative to tell the whole story.
Anyone can write clear, actionable reports if they take the right steps to streamline their processes. But only Quire users get our innovative and collaborative report writing software that saves teams more time on every report. Many of the efficiencies above are built into Quire, and our success team will help you set up the rest.
See for yourself-request a demo today.