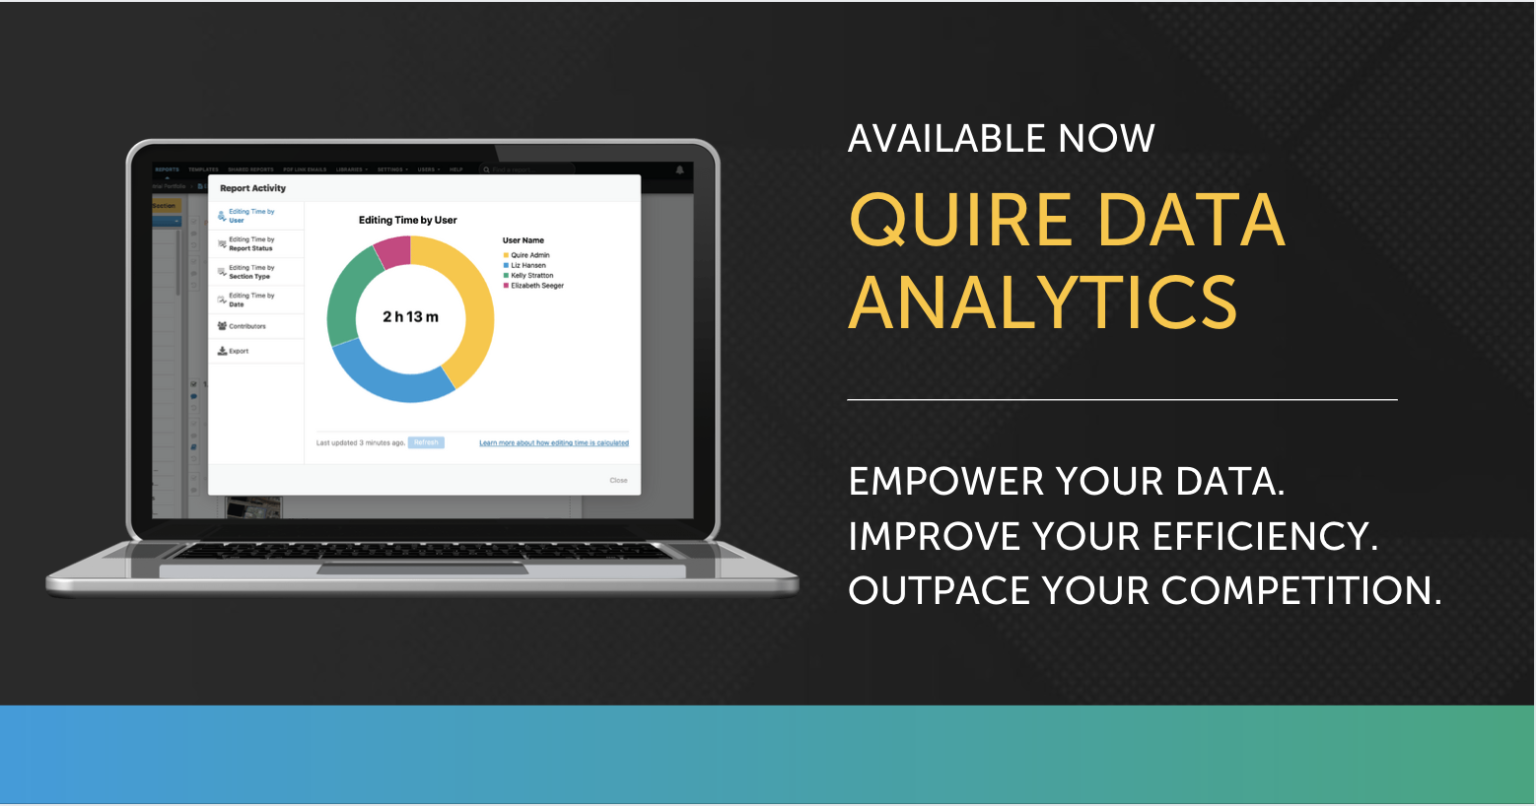
Get ready to change the way yourwork flows. Quire is proud to announce our brand-new Data Analyst Role, which gives designated Users access to one-of-a-kind data. You'll work smarter-not harder-with valuable insights on your Report-writing productivity (and your competitors').
Last month, Quire rolled out the option to add Data Analyst seats for Admin and System Admin Users. Those who are taking advantage of this feature have already found ways to make strategic, data-driven decisions and trim the fat from their processes.
“Quire has helped thousands of Users disrupt convention and streamline technical report writing, editing, styling, data entry, and approvals,” says Kelly L. Stratton, Quire CEO & Founder. “With this new Feature, Quire Clients are already saying the new data has opened their eyes to bottlenecks, bringing them another step closer to improving their bottom line.”
HOW THE DATA ANALYST ROLE EMPOWERS YOUR REPORT-WRITING PROCESS
Whether you're just dipping your toes into the Quire platform or you're a long-time User, this Feature can help you identify and eliminate roadblocks to productivity and cost savings. Here's how the Data Analyst-exclusive metrics help.
Determine the average editing time for an overall service line
Get automated monthly emails that summarize your Report workflows, plus in-app access to updated Report-writing and editing data.
Understand your workflow and turnaround times
This can help identify bottlenecks in your process or areas where more help may be needed for strategic resource allocation.
Compare the human resource cost and performance between different Templates within the same service line or across different service lines
Determine which Templates are creating pain points for your people and which are smooth sailing, allowing you to optimize processes and resources for any service line.
Understand your inbound project volume by service line
Find out which service lines take up the most time, and how profitability may vary between each.
Uncover the details of various activities in Quire
Do specific Sections take your users too much time? Want to learn more about how a specific User's time is spent? Sort the editing time data how you need to, including by:
- Section Type
- Report Status
- User
- Date
- Template
Compare your average editing times against the rest of the industry
You may know how your Report quality compares to the industry, but how about your efficiency? Understand your profitability and how your results compare to those of companies completing similar work.
WHAT GOOD IS DATA WITHOUT ACTION?
Quire's Data Analyst role shines a light on bottlenecks and unnecessary time sucks to help you make drastic improvements in your reporting workflow. Consider these questions:
Do your average breakdowns align with the time and resources you allocate to each Report?
When we beta tested the Data Analyst Role with a few of our Clients, some were shocked at the time spent on each Report. Many tended to assign resources and time allocations based on what they thought was happening, but actual time breakdowns demonstrated a knowledge gap.
Which service line is most profitable?
You can make workflow improvements all you want, but if you're making them to the wrong Report components, it's probably not affecting your bottom line. The strategy is simple: prioritize your profitable projects, and discover ways to make them even more efficient.
-
Contact Quire to learn more about how you can access smart data that actually makes an impact on your efficiency.