Quire Launches QuireSight Analytics: The Revolutionary Way to Analyze Report Writing Data

The Quire platform is already a powerful tool for improving Technical Report Writing-equipping your teams to work smarter and faster, so you can boost productivity and profitability.
When Quire rolled out its new Data Analyst Role, the goal was simple: Empower your designated Users to access one-of-a-kind data, to further improve the report writing function.
How? By making it easy for them to spot-check active editing times in reports, identify and eliminate report writing bottlenecks, benchmark your workflow against the competition, and make measurable improvements.
If that wasn't enough, the Quire platform just got a whole lot more powerful with the addition of QuireSight Analytics. It's a powerful new add-on to the Data Analyst Role”¦and a revolutionary way to analyze report writing data.
More Insights = More Productivity and Profits
For any business creating complex technical Reports, the goal of improving report writing efficiency and productivity isn't new. The trouble is, many companies make decisions about how to improve report writing based on hunches and assumptions. They might even add more staff because they suspect they need more report writing capacity.
Before you make costly decisions about how to improve your report writing and allocate expensive resources, you need meaningful data that yields actionable insights.
That's exactly what you'll get with QuireSight Analytics.
When you combine QuireSight Analytics with the Quire platform and Data Analyst Role, you gain visibility into data that can drive informed, impactful decisions-empowering you to improve your report writing for better productivity and profitability.
QuireSight Analytics Offers Insights Like These:
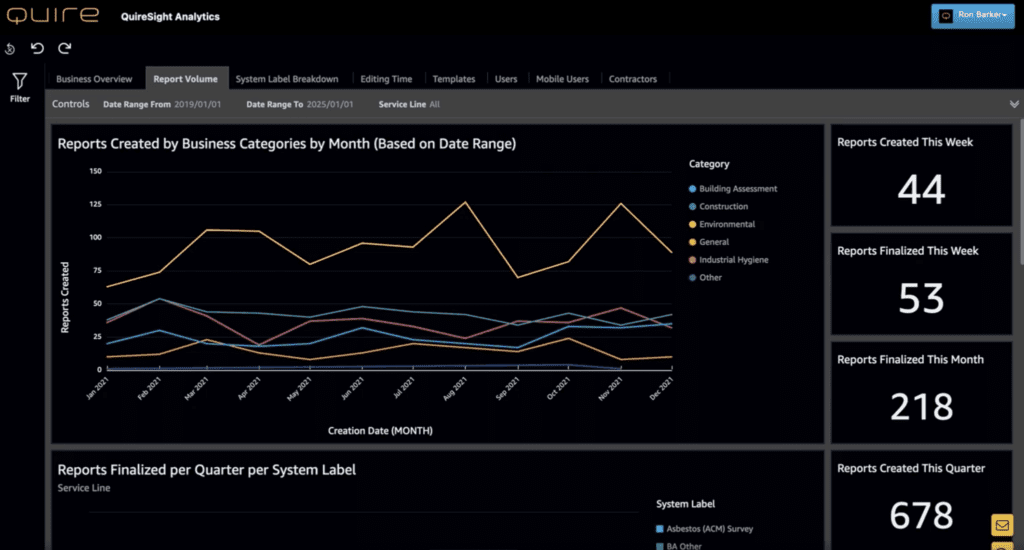
With just a couple of clicks, QuireSight Analytics provides report delivery intelligence that you've never seen before with custom views of the data you need to make the best decisions about your report writing function. Just choose the timeframe you're interested in and the level of granularity you need to see. QuireSight Analytics does the rest.
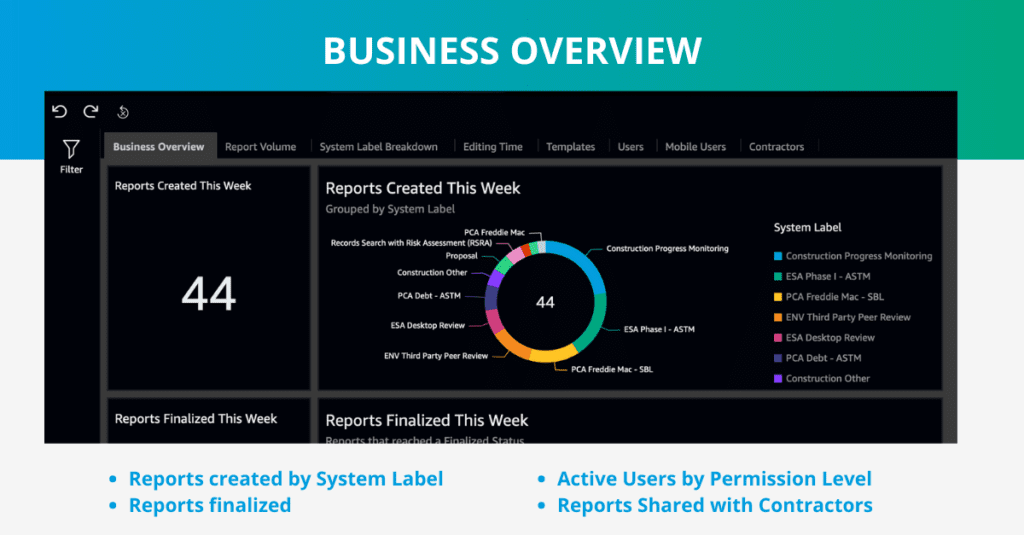
Want a snapshot of your business activities? Click the QuireSight Analytics Business Overview tab for an easy-to-follow view of Reports created, finalized, and shared for the week and month.
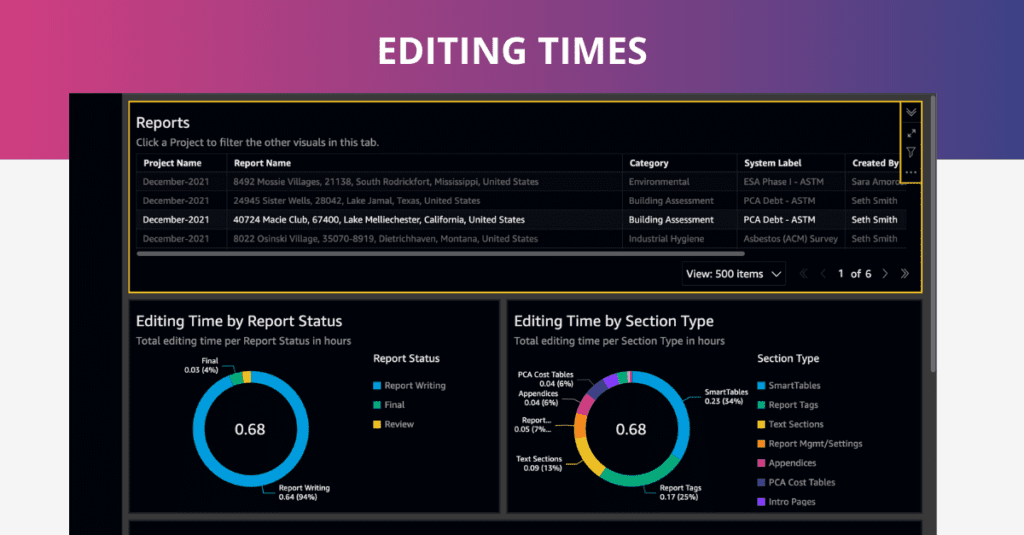
Wondering how much time your Users spend on Report editing? The Editing Times tab has views and tables that slice-and-dice the data by individual Report, Section type, or Report Status.
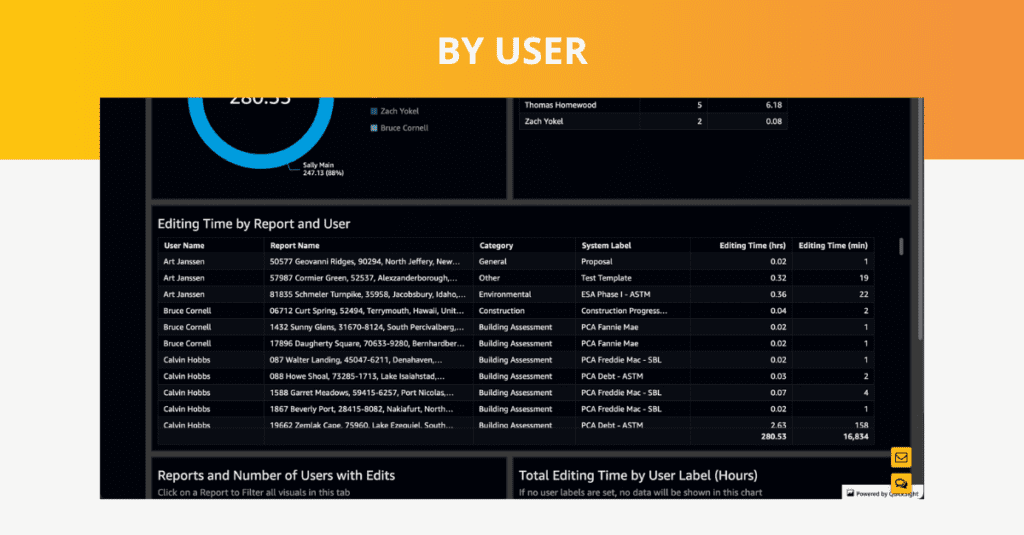
Looking to take a deep dive into your team”˜s report writing activity? Check the Users tab for details like number of Reports edited by User, total editing time by User, and more.
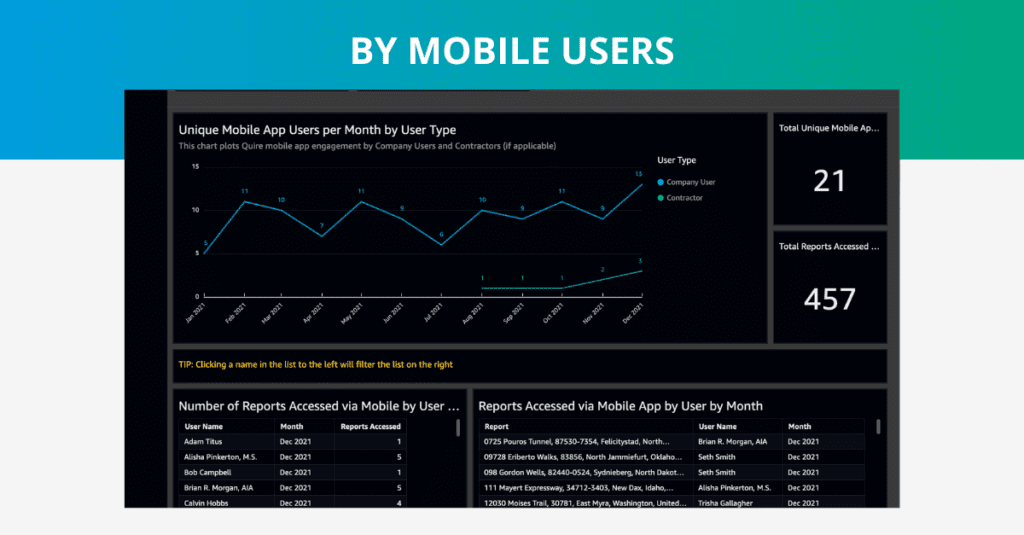
Want to understand how your report writing team is collecting data in the field? Check out the Mobile Users tab to see Quire Mobile App usage by User type, number of Reports accessed via mobile, and metrics by month.
QuireSight Analytics provides the ultimate data view experience-empowering you to make strategic decisions about your report writing workflow and resources based on actionable insights. Stay tuned as the Quire team releases new enhancements to QuireSight revealing market benchmarks, average report turnaround times, and more!
Looking to improve your report writing efficiency and profitability based on meaningful data? Contact Quire to learn about our Report writing platform and the new QuireSight Analytics Feature!